- HOME
- AI System
- Ready-Made AI
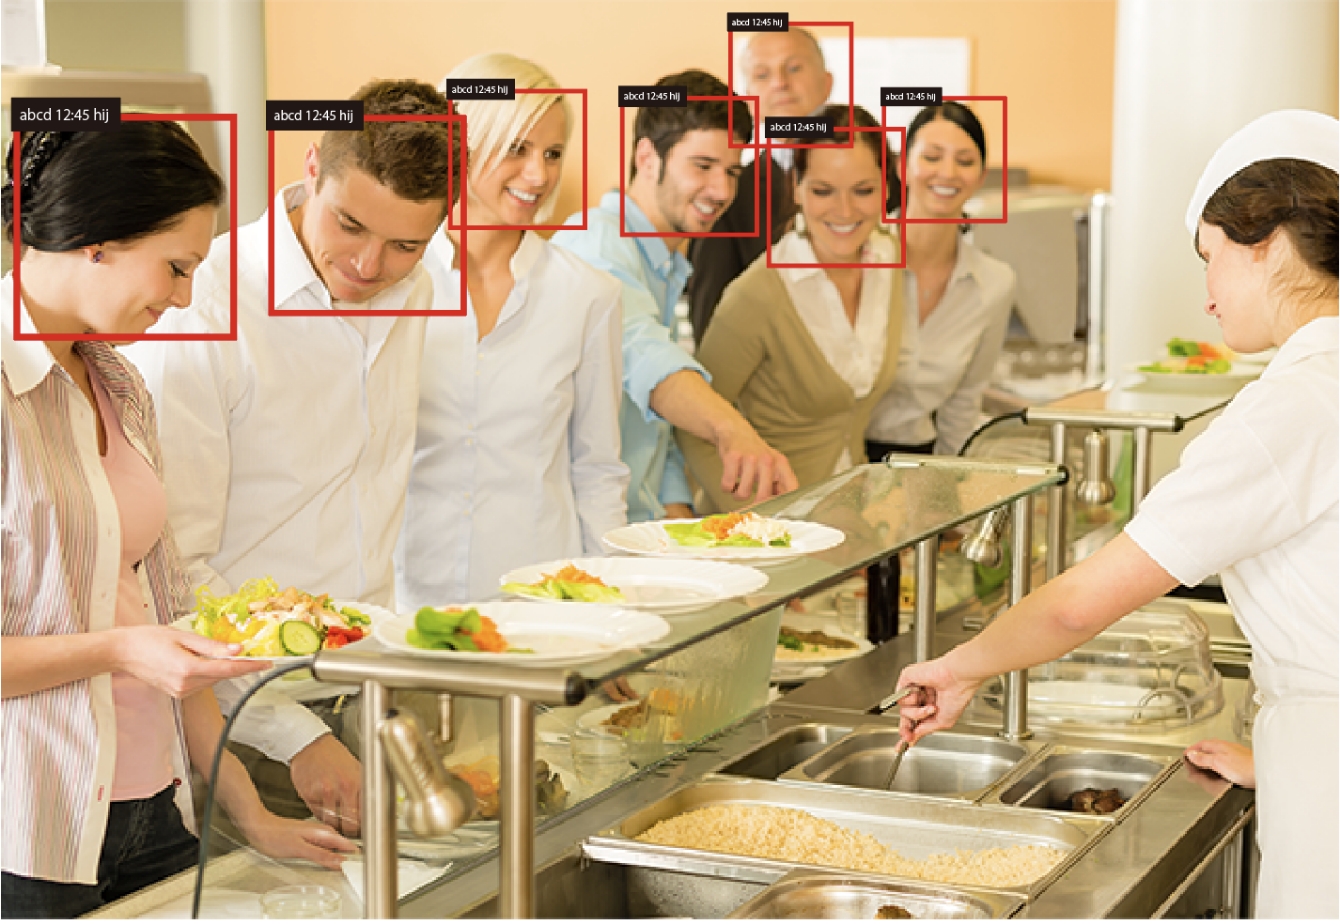
- Use Case 【Office / Cafeteria】
Smart Office / Cafeteria
We use edge AI to build web systems that are effective in alleviating congestion in facilities and stores.
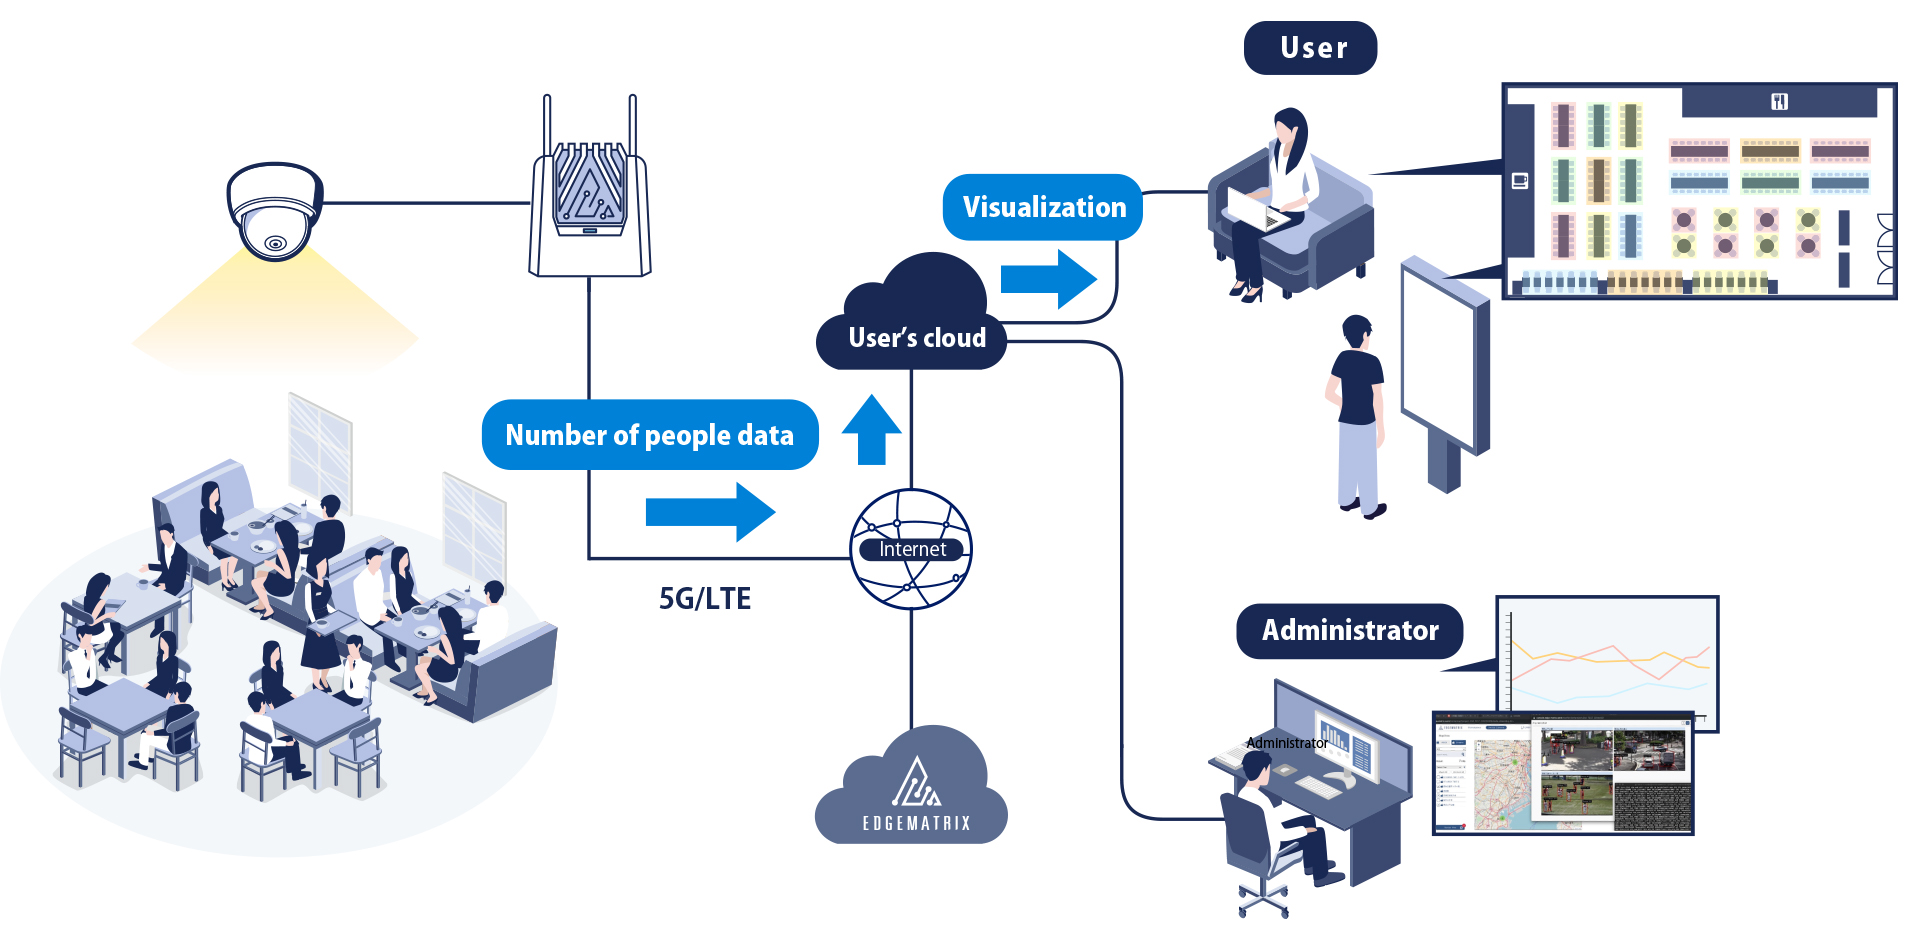
Real-time monitoring of human congestion can be used to avoid crowding and close proximity. By visualizing the situation on an original map, users are encouraged to take action to avoid congestion. Since the system does not record video but only acquires data on the number of people, it can be introduced with peace of mind from the standpoint of privacy.
|Selling Points|
Quantitatively grasp congestion status.
Data can be converted in real time.
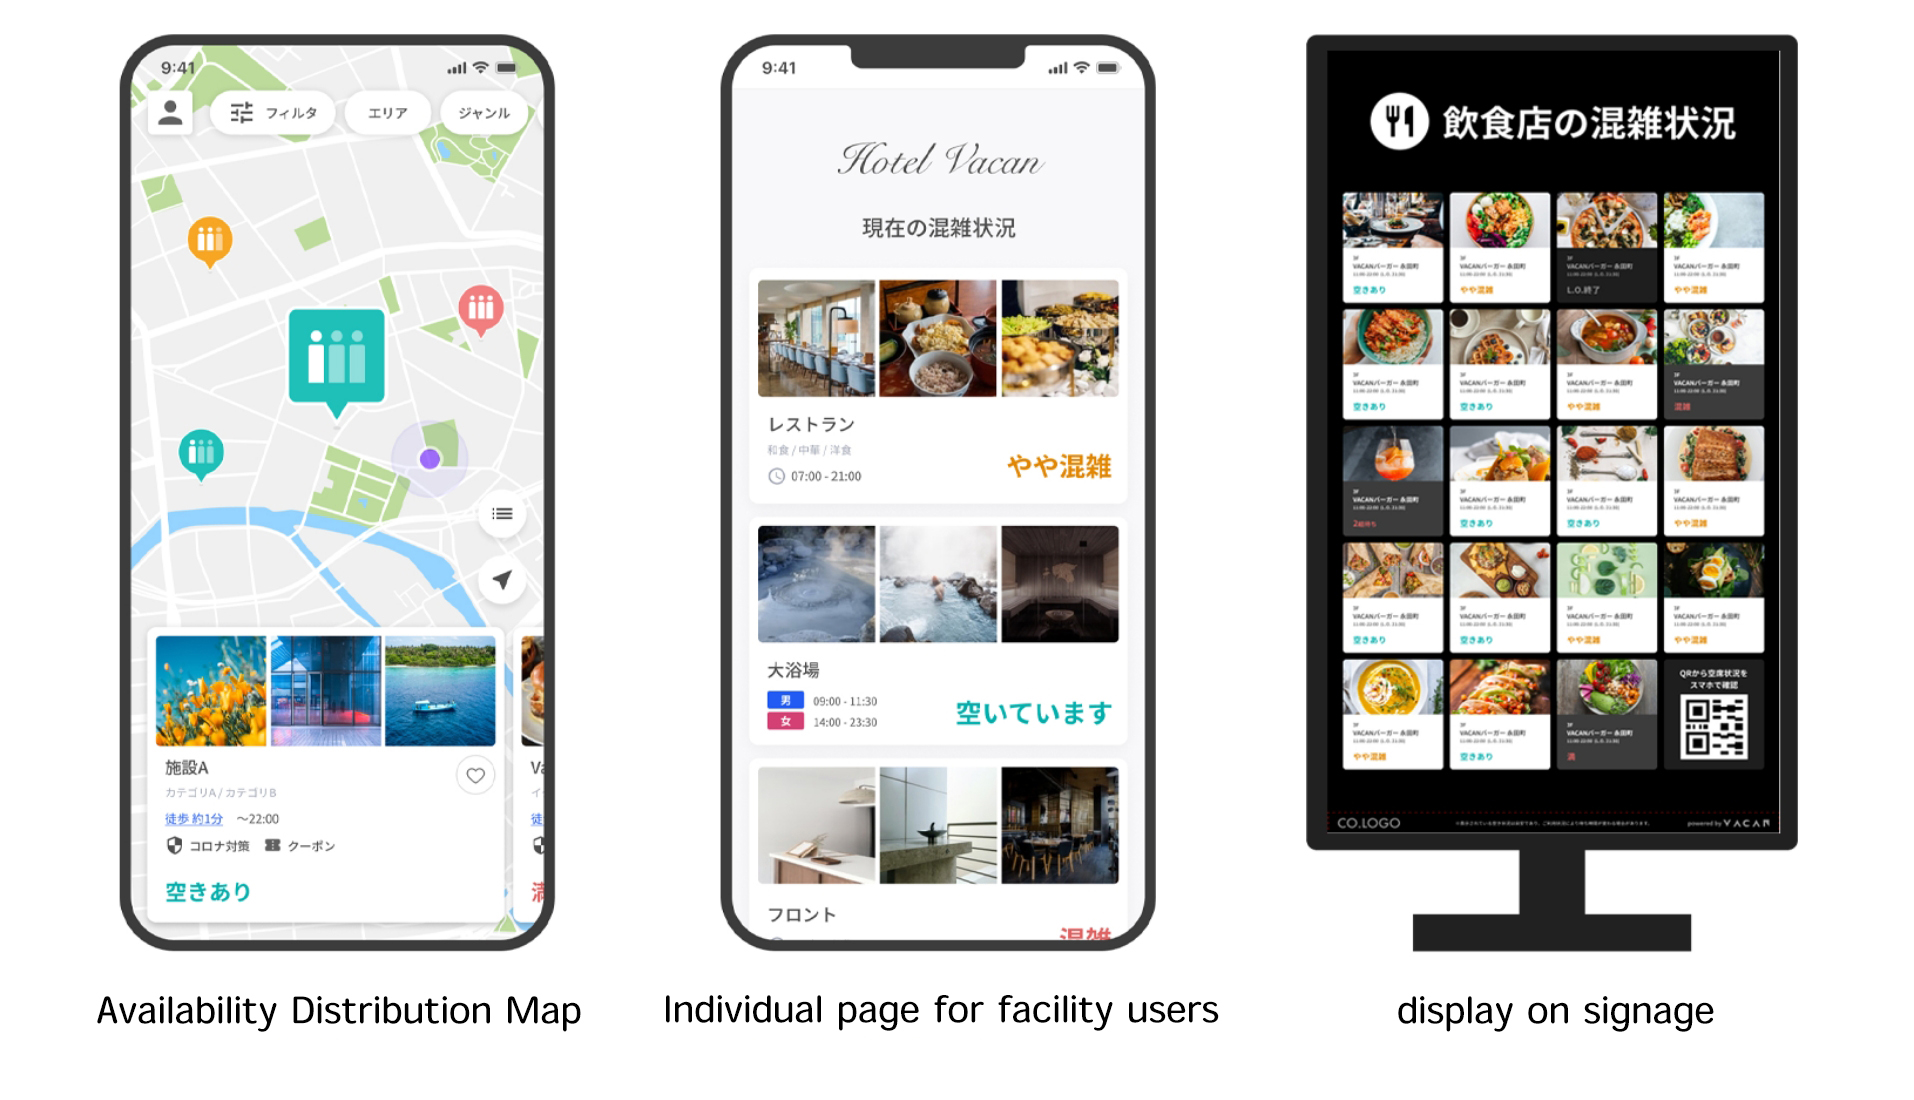
You can visualize the congestion situation.
|Standard Features|
Use a people counting AI app
For counting people, we use「人数カウントHEAD」(日本システム開発株式会社), which is available in the EDGEMATRIX store. By using a general-purpose store app, you can smoothly manage surveillance cameras and link with visualization systems.
Original maps of public spaces, etc.
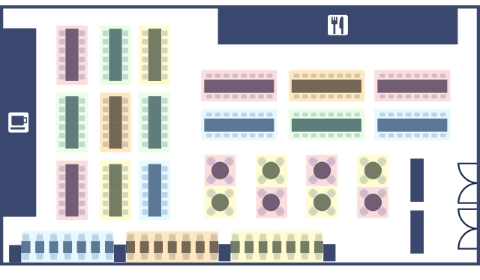
Custom-developed websites that users use can be viewed as heat maps to encourage congestion-avoidance behavior.
Capable of detecting various congestion conditions
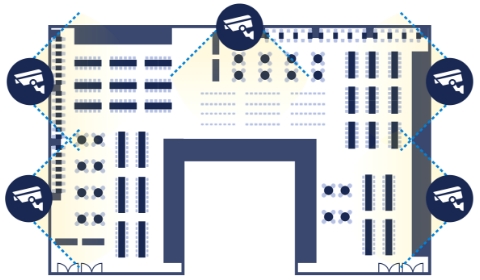
The threshold for how many people are considered congested can be freely set, making it convenient to use according to the situation. Even if the area where congestion is to be detected is large or complex, multiple cameras can be installed to cover the entire area.
(An IP camera must be installed to use this service.)
This service can be used to monitor congestion and usage of various facilities!
It can be used to reduce congestion and understand usage in places such as employee cafeterias, free access areas in offices, floors of public facilities, and exhibition areas, as well as event venues, stadiums, and evacuation shelters.
|Usage Scenarios|
Food courts and cafeterias
The system can determine the degree of congestion by measuring the number of people staying in a specified area from surveillance camera images of food courts and cafeterias. By displaying the determined congestion level (e.g., “crowded,” “slightly crowded,” “empty seats available,” etc.) on a website or display, it is possible to improve convenience for facility users, This can improve the convenience of facility users. In addition, by analyzing the congestion status of each store, it is possible to improve the efficiency of operational planning, such as staffing.
Exhibition booth at the event
It is possible to measure the number of people from surveillance camera images of exhibitor booths and determine the dates and times when the booths are crowded. By totaling and analyzing the accumulated measured number of people, it is possible to analyze the times when the booth was crowded, popular events, and the number of booth visitors.
Free access office and working space
By measuring the number of people currently using the facility from surveillance camera images of free-access offices and working spaces with a limited number of seats, it is possible to confirm whether there are any seats available. By displaying information on the website and displays in the facility, whether the space is full or empty, we can improve the convenience of facility users.
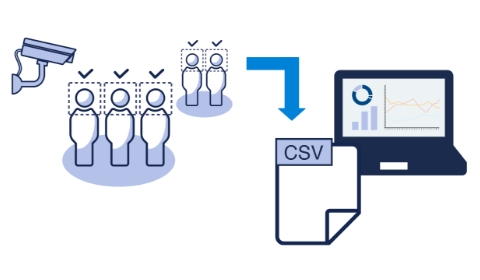
|System Configuration Chart|
Easily introduce a web system that is effective in reducing congestion.